Linear modal & nonmodal stability of fluid flows
Incompressible fluid flows, governed by the incompressible Navier-Stokes equations, are of considerable phenomenological richness. This includes forming complex spatio-temporal patterns, chaos, turbulence, and many others.
Some of these observed phenomena could find elements of explanations by characterizing the linear response, i.e., the response to infinitesimally small disturbances, of the Navier-Stokes equations. This typically includes computing the eigenvalues and eigenmodes of the linearised operator, since, at least in the limit \(t \rightarrow \infty\), the linear response of the flow to an initial perturbation will be structurally dominated by the eigenmodes associated with the least stable/most unstable eigenvalue . Such analysis, concerned with the computation of eigenmodes, is referred to as being “ modal ”.
While modal analyses of fluid flow are certainly relevant, the seminal work of Trefethen et al. has also revealed that they are sometimes incomplete (even while remaining in a linear regime). Indeed, if \(u\) denotes the velocity field of flow, the advective term \((u \cdot \nabla ) u\) present in the Navier-Stokes equations gives a preferential direction to the flow, and thus its linearisation makes the resulting operator non-normal . This means that the action of the linearised operator does not commute with that of its adjoint. In that case, the finite-time flow response typically results from a complex interplay between a large number of eigenmodes . Here, the restriction to the least stable/most unstable eigenmode structure is generically irrelevant. Furthermore, still at a finite time, a negative growth rate for all eigenvalues is not a guarantee for the energy to decay monotonically for all initial conditions: some small-amplitude initial perturbations may experience a considerable transient amplification .
The response of a non-normal system to a harmonic forcing is also typically associated with a substantial input/output amplification, much larger than the inverse of the smallest damping rate, and at forcing frequencies that can be completely different from the least stable eigenfrequencies !
Modal stability analyses have thus been generalised to said “ nonmodal ” ones, where singular modes of the operator mapping the input onto its output are found to furnish a much more efficient basis than its eigenmodes (hence the adjective “ nonmodal ” where “ non-eigenmodal ” should be understood)
As listed below, my colleagues and I have applied both modal and nonmodal tools to study different flows!
Modal analyses
-
Flows in the atmosphere or ocean are often stably stratified in the vertical, with the horizontally averaged density decreasing with height. Such environmental flows are characterized by a background velocity that decreases with height, resulting in vertical shear. This combined effect of buoyancy and shear results in a large variety of interesting dynamical behaviors!
Examples include the Holmboe instability, associated with relatively sharp density gradients, and giving rise to finite-amplitude propagating waves accompanied by vortices above and below the density interface. The Holmboe instability thus contributes to the mixing and transport of heat, salt, or indeed various pollutants.An important ingredient influencing Holmboe waves is the spatial confinement, inherent to many geophysical flows such as valleys, estuaries, submarine canyons, straits, or deep ocean trenches, as well as to lab experiments.
However, laboratory observations in confined geometries are often compared to stability analyses that ignore confinement, and numerical simulations usually impose periodic boundary conditions. Instead, on the occasion of my Master’s project at the University of Cambridge, François Gallaire, Adrien Lefauve, Colm-Cille Caulfield, and I have showed in (Ducimetière et al., 2021) that the presence of rigid walls has a major impact on the stability of Holmboe waves in the experimental inclined square duct shown in figure 1.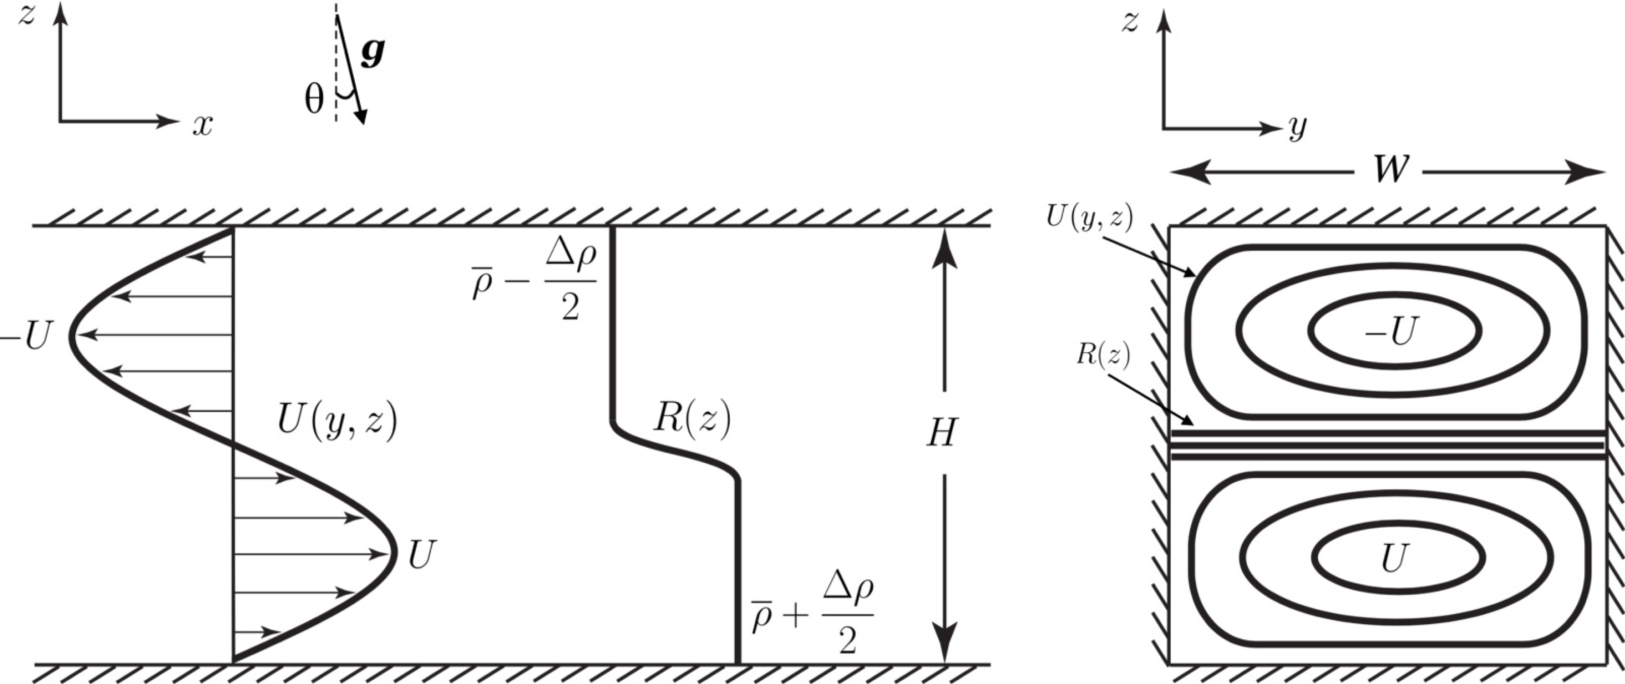 Figure 1. Schematic of the confined duct flow configuration (dimensional variables) studied in (Ducimetière et al., 2021).
In broad outline, the presence of the lateral duct walls has a stabilizing effect, except in a negligibly small region of the (limited) parameter space that we have considered (see Fig. 2a). There, a tight confinement is a necessary ingredient for the destabilization of an eigenmode whose spatial structure resembles a “ twisted ” version of the Kelvin-Helmotz one (see Fig. 2b).
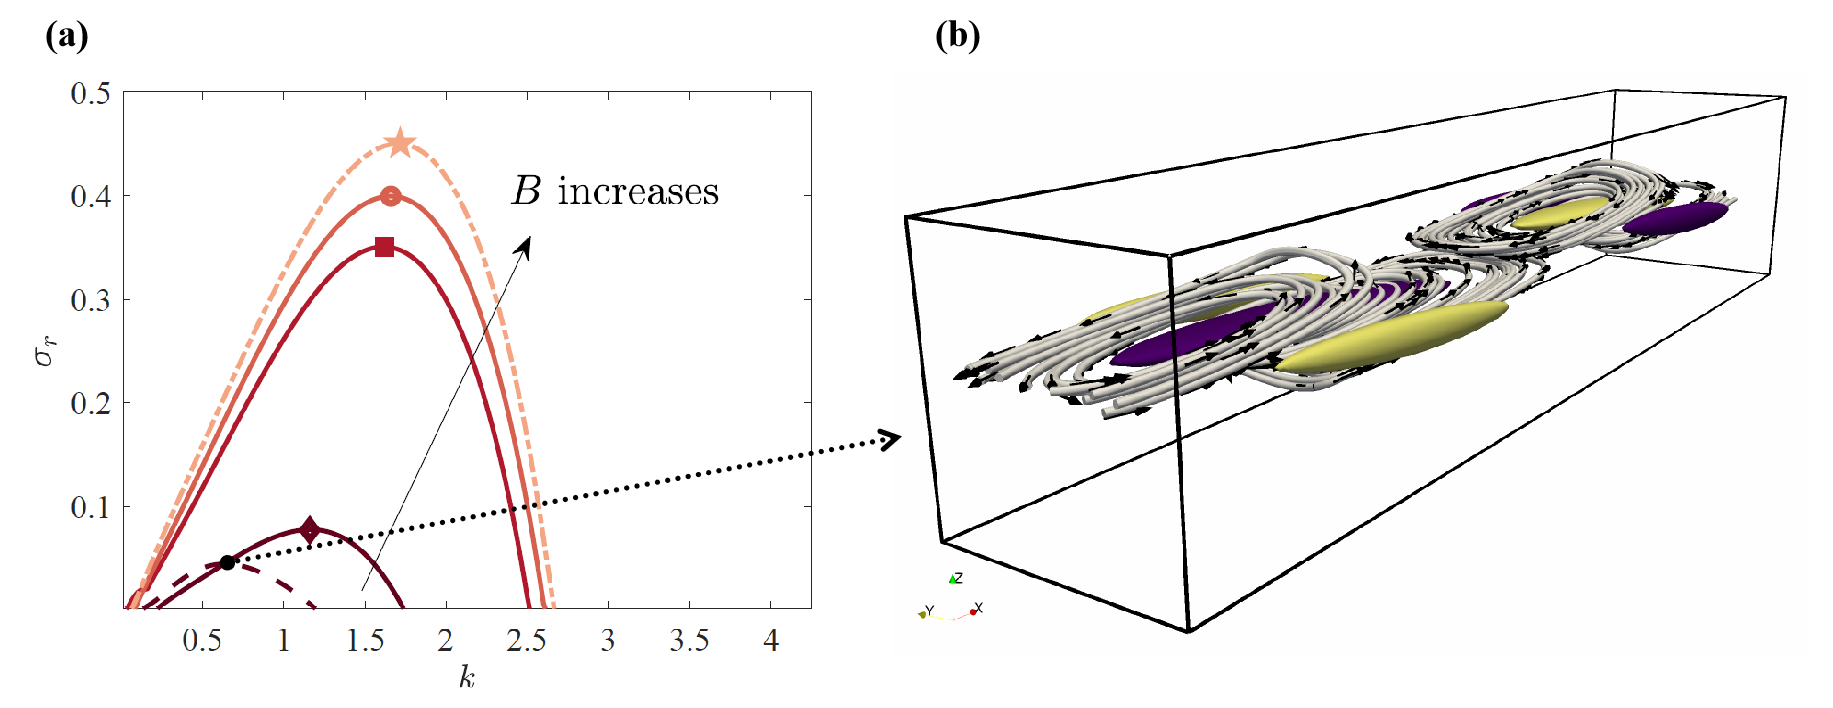 Figure 2. (a). Growth rate \( \sigma_r \) of the most unstable eigenmode of the spectrum for the flow considered in Fig. 1, where the spanwise profile of the base flow is a Poiseuille profile. Four different aspect ratios \(B = W/H \) (see Fig. 1 for the notations) are considered. Solid and dashed lines stand for the 2D problem, accounting for the lateral confinement, and lighter shades of grey correspond to higher \( B \in [1, 3, 5] \). Dash-dotted lines mark the 1D problem where \( B \rightarrow \infty \). A marker, different for each \( B \), indicates the maximum growth rate. The dotted arrow refers to (b) the unstable eigenmode inherently linked to a tight lateral confinement and resembling a “ twisted ” Kelvin-Helmholtz mode. Yellow and magenta surfaces are isocontours of equal and opposite values of the \(z\)-component of the vorticity.
Nonmodal analyses
-
Thin films flowing on substrates are ubiquitous both in nature and in industrial applications. Examples include lava flows on volcanoes, the spreading of paint, or spin-coating processes. These flows are typically driven by body forces, for instance, centrifugal or gravity, or surface-shear forces. They have in common the presence of a capillary ridge in the vicinity of the contact lines, the flow around which can be assumed to be quasi-static in most of the cases considered in the literature. In turn, the stationarity of flow here indeed justifies the resort to a modal analysis, which has revealed the ridge to be unstable in the spanwise direction, resulting in the formation of “ fingers ”.
However, there are many flow configurations where the flow solution around the ridge cannot be considered as being quasi-static. This includes flows over curved surfaces, where the forces acting on the advancing ridge vary depending on its spatial location (see Fig. 3a). The generically fast time-dependency of the base flow there makes a modal analysis inappropriate. Indeed, the eigenmodes generically do not evolve exponentially in time if the base flow over which they have been computed itself is rapidly modified in time!
A nonmodal analysis, on the other hand, supports any form of temporal analysis of the base flow. Considering a fluid spreading on a horizontal cylinder under the action of gravity (see Fig. 3a), Gioele Balestra , Mohamed Badaoui, François Gallaire, and I have thus conducted in (Balestra et al., 2019) an optimal transient growth (nonmodal) analysis to find out both the optimal perturbations of the initial film thickness and the cylinder topography (see Fig. 3b).
 Figure 3. (a) Sketch of the geometry of the problem considered in (Balestra et al., 2019). (b) Decomposition of the free-surface elevation \( \overline{H}+\overline{H}^o \) starting from the smooth cylindrical substrate into the draining solution \( H \) and perturbations \( \epsilon(h + h^o) \) for the optimal transient growth over a perturbed substrate with an initially uniform film. The liquid thickness is \( \overline{H} = H + \epsilon h \) whereas \( \overline{H}^o = \epsilon h^o \) is the substrate-topography perturbation.
For a given set of parameters, including the spanwise wavenumber \(\beta\), my contribution to the article was to derive the algorithm shown in Fig. 4.
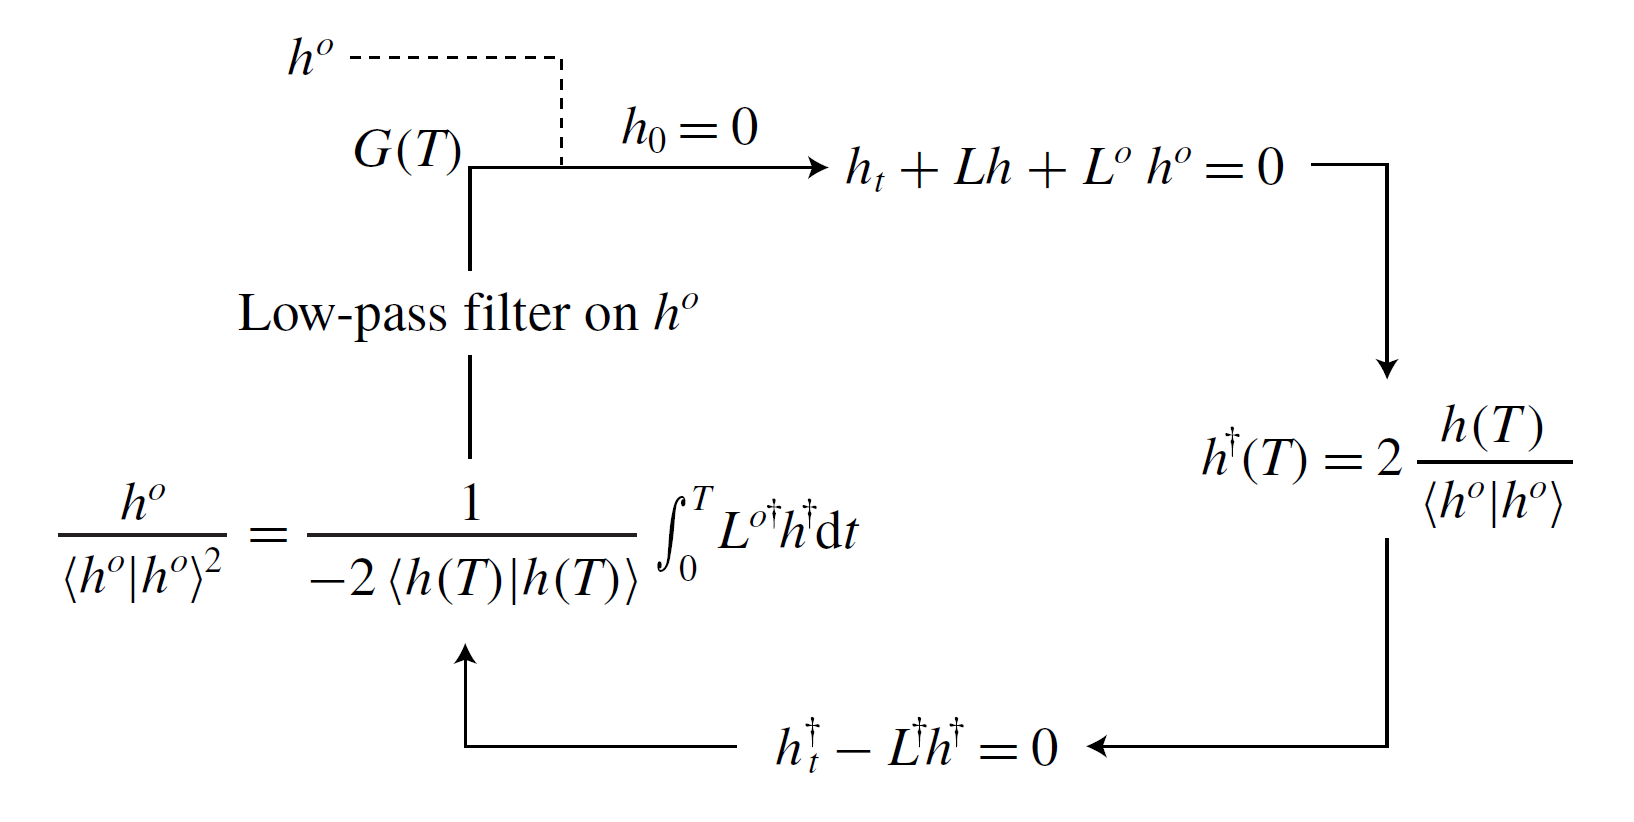 Figure 4. Sketch of the iterative procedure to find the optimal gain and substrate perturbation for a given time horizon \( T \), spanwise wavenumber \( \beta \), Bond number \( Bo \), and film aspect ratio \( \delta \).
The latter algorithm provides the optimal azimuthal profile of the perturbation \(h^o\), which, when applied to the cylinder topography, maximizes the transient gain
\[G(T) = \frac{\langle h(T) \mid h(T) \rangle}{ \langle h^o \mid h^o \rangle}\]where \(h(T)\) is the thickness of the film perturbation at \(t=T\) and \(\langle \bullet \mid \bullet \rangle\) is the \(L^2\) inner product over the azimuthal coordinate. The optimization is repeated for many different \(T\) and \(\beta\).
We found in particular that, among all the \(\beta\), the one leading to the largest \(G(T)\) (all \(T\) considered) is in good agreement with that measured experimentally in Takagi & Huppert . That is presumably because in an environment which is not perfectly controlled (which is typically the case in experimental flows), the actual cylinder topography has a component along all \(\beta\) (and all members of the azimuthal profile basis for a given \(\beta\)). Thereby, it is natural to expect the most amplified \(\beta\) to be the one that emerges among all.
-
The gravity-driven flow of a liquid film coating the inner solid wall of a horizontal cylinder (see Fig. 5a) exhibits a very rich dynamics, and some of the observed phenomena are potentially important for industrial and medical applications. Examples include two-phase heat-exchangers and the flow in the airways of human lungs. However, in addition to the presence of a liquid-gas interface, a difficulty that arises in studying this flow is its inherent non-stationarity. Indeed, under the effect of gravity, the liquid is constantly draining around the core bubble, which makes the gaseous bubble move upward under the buoyancy effect. Thereby, the base flow under which to linearize the system of equations is necessarily time-dependent.
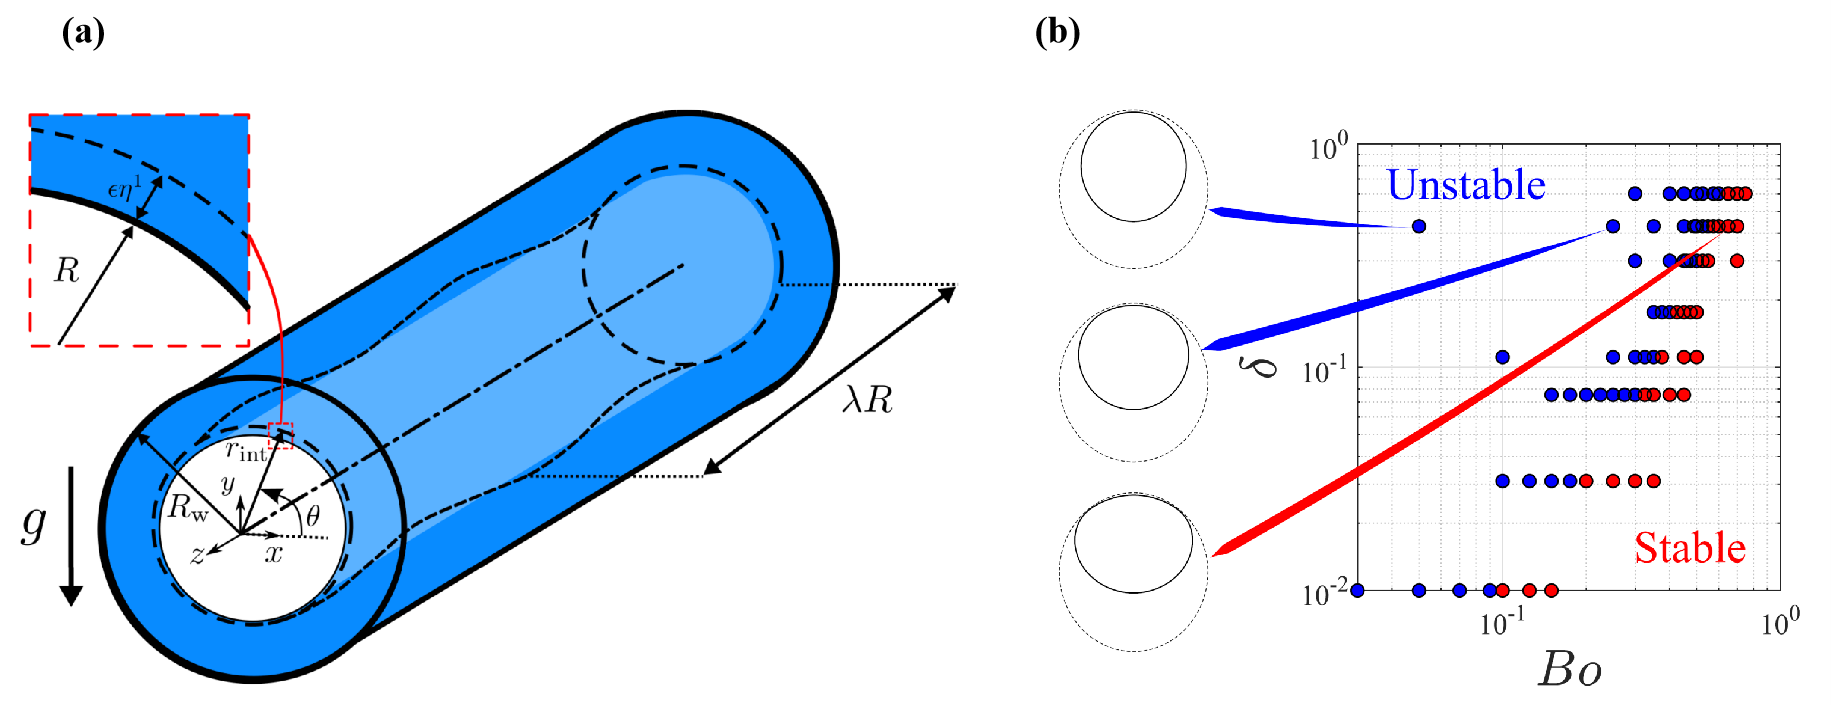 Figure 5. (a) Schematic of the liquid film coating the inner side of a horizontal tube and the geometrical parameters considered in (Eghbali et al., 2023). The thick, solid black line shows the tube wall. The dashed black line represents the perturbed liquid-gas interface. The inset shows the zoomed cross-section of the initial perturbed interface. The gravitational field acts vertically, perpendicular to the tube axis. (b) Linear stability diagram in \( \delta\) vs \( Bo \) plane; the symbol \( \delta\) denotes the (dimensionless) initial film thickness. The blue and red bullets are obtained from the numerical stability analysis. Three base interfaces, corresponding to the final times of the simulations, are shown for \(δ = 0.43\) and \( Bo = [0.05, 0.25, 0.65] \).
In (Eghbali et al., 2023), my colleagues Shahab Eghbali , Edouard Boujo, François Gallaire, and I first proposed a modal stability of the flow (see Fig. 5b), whose results are supposedly relevant as long as the growth rate of the dominant eigenmode is much larger than that of the temporal variation of the base flow (i.e., under the quasi-static approximation). We explored the effect of the \(Bo\) number (comparing the strength of gravitational over surface tension forces) and the \(Oh\) number (comparing the strength of viscous over inertial forces). For the reasons developed in the article, we found that increasing the \(Bo\) number had a clear stabilizing effect on the flow. Changing the \(Oh\) number, on the contrary, only had a minor influence.
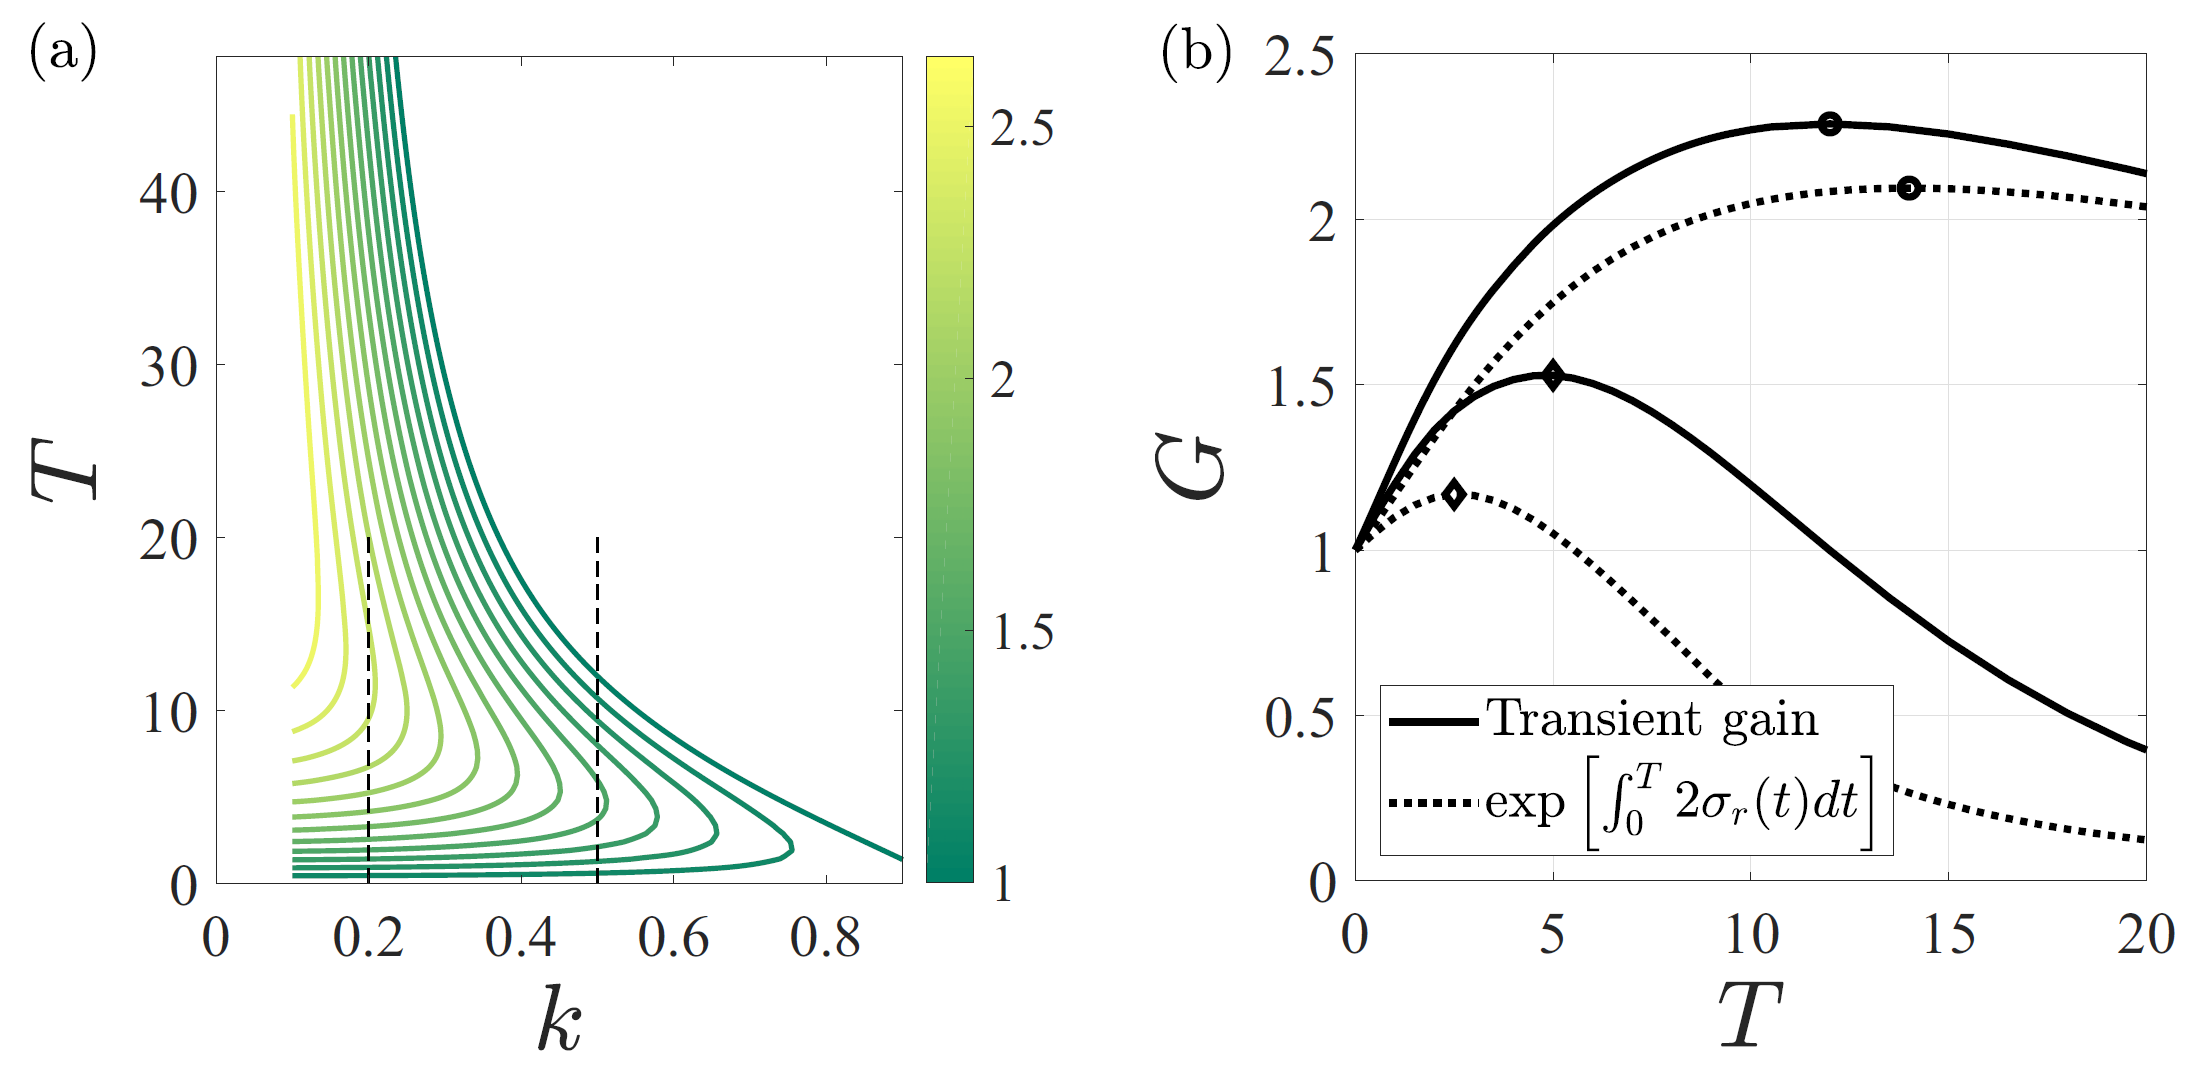 Figure 6. For \( Bo=0.65 \) and \(\delta = 0.43\). (a) Isocontours of the transient gain \( G \) in the \(k-T\) plane with \( T \) the temporal horizon and \( k \) the wavenumber along the coordinate \( z \) along the tube axis. Only the region \(G \geq 1 \) is shown. (b) Along the thin dashed lines in (a), comparison of the transient gain (full line) with its approximation using the dispersion curve only (dotted line), for \(k = 0.2\) and \(k = 0.5\) (maximum gain highlighted by a circle and a diamond, respectively).
We also found that the quasi-static approximation was valid only for large times, which makes the modal analysis valid only there (note that, in any case, a modal analysis is conclusive only in the limit \(t \rightarrow \infty\) for non-normal operators!). At the early times, however, a nonmodal transient growth analysis was needed, as it can rigorously account for the temporal variation of the base flow. The transient growth analysis focused mostly on the stable region of the parameter space, for it reveals the potential for the flow to experience a subcritical transition there.
We found that, for all the considered parameters, the maximum possible transient gain (i.e., the ratio between the interfacial energy of the interface perturbation at some temporal horizon \(T\), divided by that of the initial condition which seeded it) remained of \(O(1)\) (see Fig. 6). Therefore, for this particular flow, the modal stability analysis seemed to provide a sufficiently complete description if the linear dynamics!
References
2023
- PRF
2021
- PRF
2019
- JFMFingering instability on curved substrates: Optimal initial film and substrate perturbationsJournal of Fluid Mechanics, 2019